
Socio-Economic Profile of County Clare/ Próifíl Socheacnamaíocha de Chontae an Chláir
Introduction
The publication of the Census 2006 data by the Central Statistics Office provides an important resource to identify key demographic and socio-economic trends nationally, regionally and at county and local level. This section profiles some of the most significant trends and indicators that are particularly sensitive to enterprise development in County Clare. Here, only the most significant data (including results from Census 2006) examining
key demographic trends, rurality and population density, age profiles, education and socio-economic status, place of work, location and size of enterprises, FDI and industrial production are reviewed.
Key Demographic Trends
In this section, changes in population for County Clare between 1991 and 2006 are illustrated. The focus is on county and regional level changes, but data are also provided for the 11 Urban and Rural Districts in Clare. These are the Urban Districts of Ennis and Kilrush and the Rural Districts of Ballyvaughan, Ennistymon, Corofin, Kildysart, Kilrush, Ennis, Meelick, Scarriff and Tulla.
| District | Persons 2002 | Persons 2006 | Males 2006 | Females 2006 | Actual change 2002 - 2006 | Percentage change 2002 - 2006 |
|---|---|---|---|---|---|---|
| Clare | 103277 | 110950 | 56048 | 54902 | 7673 | 7.4 |
| Limerick City and County | 175304 | 184055 | 92680 | 91375 | 8751 | 5 |
| Tipperary NR | 61010 | 66023 | 33568 | 32455 | 5013 | 8.2 |
| Mid-West | 339591 | 361028 | 182296 | 178732 | 21437 | 20.6 |
| State | 3917203 | 4239848 | 2121171 | 2118677 | 322645 | 8.2 |
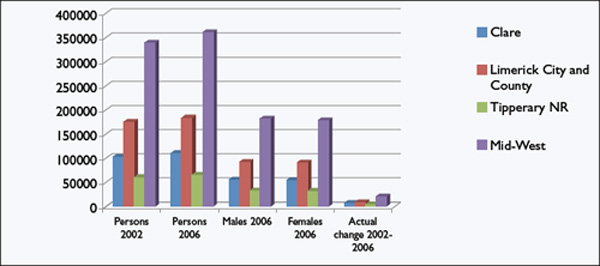
Figure 1.0 - Population change in the Mid-West counties 2002 - 2006
| Urban & Rural District | 1991 Total | M | F | 1996 Total | M | F | 2002 Total | M | F | Total | M | F |
|---|---|---|---|---|---|---|---|---|---|---|---|---|
| Clare County Ennis UD | 90918 13730 | 46367 6645 | 44551 7085 | 94006 15333 | 47789 7487 | 46217 7846 | 103277 18830 | 52063 9018 | 51214 9812 | 110950 20142 | 56048 9877 | 54902 10265 |
| Kilrush UD | 2740 | 1354 | 1386 | 2594 | 1258 | 1336 | 2699 | 1330 | 1369 | 2657 | 1352 | 1305 |
| Ballyvaghan RA Corrofin RA | 2490 3025 | 1241 1581 | 1249 1444 | 2649 3098 | 1271 1610 | 1378 1488 | 2622 3102 | 1255 1630 | 1367 1472 | 2690 3309 | 1267 1712 | 1423 1597 |
| Ennis RA | 22908 | 11700 | 11208 | 23561 | 12021 | 11540 | 26043 | 13247 | 12796 | 28622 | 14519 | 14103 |
| Ennistimon RA | 8721 | 4529 | 4192 | 8849 | 4569 | 4280 | 9482 | 4830 | 4652 | 9792 | 4968 | 4824 |
| Killadysert RA Kilrush RA | 4415 10906 | 2301 5743 | 2114 5163 | 4336 10681 | 2257 5596 | 2079 5085 | 4193 10344 | 2168 5437 | 2025 4907 | 4502 10739 | 2343 5674 | 2159 5065 |
| Meelick RA | 10895 | 5537 | 5358 | 11593 | 5876 | 5717 | 13548 | 6877 | 6671 | 15069 | 7545 | 7524 |
| Scarriff RA | 5952 | 3022 | 2930 | 6031 | 3071 | 2960 | 6600 | 3284 | 3316 | 6747 | 3415 | 3332 |
| Tulla RA | 5136 | 2714 | 2422 | 5281 | 2773 | 2508 | 5814 | 2987 | 2827 | 6681 | 3376 | 3305 |
(RA= Rural Area)
| Urban & Rural District | Actual Change 1991 - 1996 | Actual Change 1996 - 2002 | Actual Change 2002 - 2006 | Percentage Change 1991 - 1996 | Percentage Change 1996 - 2002 | Percentage Change 2002 - 2006 |
|---|---|---|---|---|---|---|
| Clare County | 3088 | 9271 | 7673 | 3.4 | 9.9 | 7.4 |
| Ennis UD | 1603 | 3497 | 1312 | 11.7 | 22.8 | 7.0 |
| Kilrush UD | -146 | 105 | -42 | -5.3 | 4.0 | -1.6 |
| Ballyvaghan RA | 159 | -27 | 68 | 6.4 | -1.0 | 2.6 |
| Corrofin RA | 73 | 4 | 207 | 2.4 | 0.1 | 6.7 |
| Ennis RA | 653 | 2482 | 2579 | 2.9 | 10.5 | 9.9 |
| Ennistimon RA | 128 | 633 | 310 | 1.5 | 7.2 | 3.3 |
| Killadysert RA | -79 | -143 | 309 | -1.8 | -3.3 | 7.4 |
| Kilrush RA | -225 | -337 | 395 | -2.1 | -3.2 | 3.8 |
| Meelick RA | 698 | 1955 | 1521 | 6.4 | 16.9 | 11.2 |
| Scarriff RA | 79 | 569 | 147 | 1.3 | 9.4 | 2.2 |
| Tulla RA | 145 | 533 | 867 | 2.8 | 10.1 | 14.9 |
At county level (Figure 1.0), the statistics indicate an increase of 7,673 persons between 2002-2006, a total of 7.4%. This is down on the previous Census year where a total population increase of 9.9% was recorded between 1996-2002. At Urban and Rural District level, the most significant population changes occur in the Meelick and Tulla Rural Areas which show population increases of 11.2% and 14.9% respectively on 2002 figures. The components of the population increase in County Clare 2002-2006 are identified by distinguishing between growth attributed to natural increases and that attributed to migration.
- Population Change 2002 - 2006: Clare 7673, State 322645
- Natural Increase (births minus deaths): Clare 3504, State 31314
- Total Estimated Net Migration1: Clare 1469, State 191331
- Average annual birth rates per 1000 population: Clare 10.5, State 10.0
- Average annual death rates per 1000 population: Clare 5.0, State 4.7
- Average annual estimated net migration rates per 1000 of average population: Clare 6.5, State 7.8
In the four-year period between 2002-2006, County Clare's birth rate of 10.5 exceeded the national average of 10.0 per 1000 population, while Clare's death rate (5.0) also exceeded the national average of 4.7 per thousand population. The above figures also show that in Clare, net migration outweighed natural increase as a contributor to population growth. This raises the question of how much of this migration is due to movements between Irish counties and how much is due to migration from oversees. The Census does not provide these figures for the entire 2002-2006 period but it does give information about movements in the year directly prior to the Census of Population 2006. In Clare, the vast majority of people (95.2%) had been living in the county in 2005 and 2006. 2.3% were classified as having lived elsewhere in the State in 2005 with a total of 2.6% having lived outside the State (UK - 0.5%; Western Europe - 0.3%; Eastern Europe 1.2%; USA - 0.2% and Other: 0.5%).
Rurality and Population Density
According to the Western Development Commission (WDC) report examining key demographic and socio-economic trends (2007), the Western Region in general is predominantly rural, with two thirds of the population (68.3%) living outside of towns with a population of 1,500 or more.
Approximately 32.6% of the population of County Clare lives in centres of 1,500+ with the remaining 67.4% living outside centres of 1,500+. Each of the larger towns (except Kilrush) in County Clare shows an increase in total population with concomitant increases in the population within legally defined boundaries and the population of suburbs or the environs. Of the five major towns in the population range 1,500-10,000, only Kilrush displayed a decrease in population of only -0.2%, with Ennis showing an increase of 10% and the population of Shannon increasing by 7.7% on the previous Census year. Sixmilebridge shows the most significant increase in population at 25% which possibly reflects the towns growing status as a commuter town situated within close proximity to both Limerick city and Ennis town centres.
| Town Population | Total Population (including suburbs or environs) 2006 | Total Population (including suburbs or environs) 2006 | Population within legally defined boundary 2002 | Population within legally defined boundary 2006 | Population of suburbs or environs 2002 | Population of suburbs or environs 2006 | Percentage change in total population 2002-2006 |
|---|---|---|---|---|---|---|---|
| Ennis | 22051 | 24253 | 18830 | 20142 | 3221 | 4111 | 10 |
| Shannon | 8561 | 9222 | 8228 | 8481 | 333 | 741 | 7.7 |
| Kilrush | 26994 | 2694 | 2699 | 2657 | 0 | 37 | -0.2 |
| Sixmilebridge | 1327 | 1659 | 0 | 0 | 0 | 0 | 25 |
| Newmarket-on-Fergus | 1496 | 1542 | 0 | 0 | 0 | 0 | 3.1 |
In relation to population density, the Census data reveal significant variations both within and between counties with those areas of lowest population density generally occurring in more remote and rural areas. (See Map 1.0 which indicates the number of persons per square kilometre).
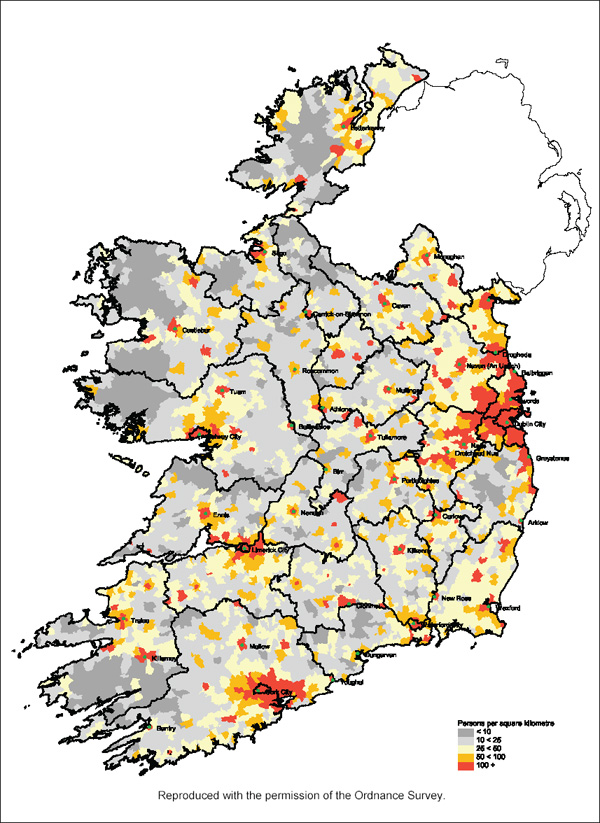
Map 1.0 - Population density of electoral divisions - 2006
Not surprisingly, the map shows a high concentration of population around the urban district of Ennis where population density ranges from 100+ per square km in the town centre to between 50-100 per square km in the periphery (indicated by red and orange reflecting high density), while the darkest grey areas, which tend to be quite remote, are those DEDs with the lowest population density. The map clearly indicates that the sparsest populations occur along the Western region possibly associated with population decline in these areas and migration to the larger urban centres. There is a stark contrast between population densities in the Western region compared to the East particularly around Dublin, Kildare, Meath and Wexford.
Age Profile of County Clare
Tables 1.4 and 1.5 show the age profiles of each of the counties in the Mid-West region and some of the larger towns in County Clare (population 1,500 +) including the distribution of population across age groups. The age of the population is significant because it represents the numbers available to become part of the labour force as well as indicating the proportion of the population who might be classified as 'dependent'.
| State | Mid-West | Tipp NR | Limerick City and County | Clare | Age Group |
|---|---|---|---|---|---|
| 4239848 | 361028 | 66023 | 184055 | 110950 | Total |
| 302252 | 25204 | 4707 | 12291 | 8206 | 0-4 |
| 288325 | 25044 | 4846 | 12080 | 8118 | 5-9 |
| 273872 | 23770 | 4549 | 11572 | 7649 | 10-14 |
| 290257 | 25700 | 4296 | 14135 | 7269 | 15-19 |
| 342475 | 28707 | 4494 | 17160 | 7053 | 20-24 |
| 373078 | 28713 | 4649 | 16104 | 7960 | 25-29 |
| 349361 | 27688 | 4962 | 14112 | 8614 | 30-34 |
| 322105 | 26645 | 4837 | 13055 | 8753 | 35-39 |
| 301329 | 25529 | 4878 | 12405 | 8246 | 40-44 |
| 274745 | 23798 | 4447 | 11767 | 7584 | 45-49 |
| 247068 | 21885 | 4147 | 10963 | 6775 | 50-54 |
| 225328 | 20347 | 3668 | 10051 | 6628 | 55-59 |
| 181727 | 16387 | 3128 | 8085 | 5174 | 60-64 |
| 143396 | 12674 | 2338 | 6352 | 3984 | 65-69 |
| 119152 | 10621 | 2249 | 5202 | 3170 | 70-74 |
| 92466 | 8203 | 1740 | 3938 | 2525 | 75-79 |
| 64884 | 5874 | 1264 | 2838 | 1772 | 80-84 |
| 48028 | 4239 | 824 | 1945 | 1470 | 85 + |
| Age Group | Total | 0-14 years | 15-24 years | 25-44 years | 45-64 years | 65 years and over |
|---|---|---|---|---|---|---|
| Ennis | 24253 | 5118 | 3225 | 8657 | 4768 | 2485 |
| Shannon | 9222 | 1903 | 1502 | 3200 | 1939 | 678 |
| Kilrush | 2694 | 502 | 307 | 670 | 717 | 498 |
| Sixmilebridge | 1659 | 391 | 211 | 632 | 326 | 99 |
| Newmarket-on-Fergus | 1542 | 275 | 251 | 432 | 413 | 171 |
Table 1.4 describes population peaks between the 20-24 and 30-34 age groups and subsequent declines in each county in the Mid-West region for 2006. In general, the relatively high numbers in the lower age categories (0-19) reflect the overall trend of increased birth rates in recent decades. A similar peak is evident at town level (Table 1.5). The figures show that the greatest proportion of the population in the Mid-West and in key towns in County Clare fall into the working age categories of between 16-65 years, while the older proportion of the population declines sharply from age 60+.
Education Status and Qualifications
The use of education status and qualifications is an important indicator of human capital, social mobility, technological competency and a potential employee's ability to adapt to continuing socio-economic change. The Enterprise Strategy Group report Ahead of the Curve, Ireland's Place in the Global Economy (2004) identifies some key aspects of education and skills development as critical to the future of the enterprise sector:
- Maximise numbers entering higher education: an adaptive and responsive higher education sector is necessary to generate the intellectual capital required to fuel an innovation driven economy.
- To foster the continual acquisition of knowledge, skills and competencies, formalized approaches to lifelong learning must be introduced and corresponding delivery structures put in place.
Tables 1.6 and 1.7 show a number of interesting trends which summarise the highest level of education attained by the population in County Clare aged 15 years and over who have completed full-time education for 2002 and 2006 and also levels of educational attainment in counties in the Mid-West region and in key towns in Clare with populations in excess of 1,500.
| Primary (incl. no formal education) 2002 | Primary (incl. no formal education) 2006 | Secondary 2002 | Secondary 2006 | Third level Non-degree 2002 | Third level Non-degree 2006 | Third level Degree or higher 2002 | Third level Degree or higher 2006 | Not Stated 2002 | Not Stated 2006 |
|---|---|---|---|---|---|---|---|---|---|
| % | % | % | % | % | % | % | % | % | % |
| 20.3 | 16.5 | 51.3 | 50.2 | 9.7 | 11.1 | 13.4 | 16.4 | 5.2 | 5.8 |
| 21.1 | 18.0 | 49.2 | 48.3 | 9.5 | 10.6 | 15.1 | 18.5 | 5.1 | 4.6 |
| District | Total | Total whose full-time education has ceased | Primary (incl. no formal education) | Lower secondary | Upper secondary | Third level, non-degree | Third level, degree or higher | Not stated | Total whose full-time education not ceased | Total at school, university, etc | Other economic status | |||
|---|---|---|---|---|---|---|---|---|---|---|---|---|---|---|
| Clare | 86977 | 74967 | 12402 | 14598 | 23001 | 8330 | 12272 | 4364 | 12010 | 7887 | 4123 | |||
| Limerick | 148112 | 122555 | 22231 | 26765 | 35837 | 13113 | 19972 | 4637 | 25557 | 18632 | 6925 | |||
| Tipp NR | 51921 | 44813 | 8193 | 10294 | 14066 | 4411 | 6067 | 1782 | 7108 | 4758 | 2350 | |||
| Mid-West | 287010 | 242335 | 42826 | 51657 | 72904 | 25854 | 38311 | 10783 | 44675 | 31277 | 13398 | |||
| State | 3375399 | 2850333 | 514085 | 573411 | 803498 | 301327 | 527775 | 130237 | 525066 | 349596 | 175470 | |||
| Ennis | 19135 | 16334 | 2177 | 2763 | 5179 | 1954 | 3390 | 871 | 2801 | 1462 | 1339 | |||
| Shannon | 7319 | 6162 | 805 | 1314 | 2314 | 644 | 791 | 294 | 1157 | 655 | 502 | |||
| Kilrush | 2192 | 1934 | 460 | 362 | 538 | 131 | 194 | 249 | 258 | 148 | 110 | |||
| Sixmilebridge | 1268 | 1091 | 179 | 253 | 334 | 137 | 154 | 34 | 177 | 112 | 65 | |||
| Newmarket-on-Fergus | 1267 | 1093 | 210 | 292 | 321 | 97 | 107 | 66 | 174 | 129 | 45 | |||
In relation to those who have at most primary or no formal education, the figures show a noticeable decrease from 20.3% in 2002 to 16.5% in County Clare in 2006. This compares favourably with the State average of 18% in this category for 2006. Those with primary/secondary education alone has also decreased slightly from 51.3% in 2002 to 50.2% in 2006 with an associated increase in the percentage of the population with third level non-degrees (increase from 9.7% to 11.1%) and third level degree or higher (13.4% to 16.4%) in the four year period to 2006. However, although those with a third level degree or higher in County Clare has increased on the previous Census year, the figure still falls below the State average of 18.5% for 2006.
In the Mid-West region, of those whose full time education has ceased, 17.6% have only primary education or no formal education, just below that State average of 18%. 10.7% have third level non-degree qualifications, while 15.8% have third level degrees or higher. Of the towns in County Clare with a population in excess of 1500, 13.3% of the population of Ennis, 13% of the population of Shannon and 16.5% of the population of Sixmilebridge had primary education only including no formal education in 2006 (below the State average), while of those whose full time education has ceased, Kilrush, 23.8% and Newmarket-on-Fergus, 19.2% record figures higher than the State average. Of the five towns (populaiton 1500+), Sixmilebridge boasts the largest proportion of population with a third level non-degree qualification at 12.6% , followed by Ennis at almost 12%, Shannon 10.5%, Newmarket-on-Fergus 8.9% and Kilrush at 6.8%. Ennis records the highest proportion of the population with a third level degree or higher at 17.5%, followed by Sixmilebride at 14%, Shannon at 12.8%, Kilrush at 10% and Newmarket-on-Fergus at 9.8%. However, all five towns fall below the State average of 18.5% for 2006.
Of those persons in the Mid-West region with a third level qualification having completed 2 years or more of study, the highest number of graduates are found in the Social Sciences and Business, followed by Engineering, Manufacturing and Construction and the Health professions. Proportionately, of those persons with a third level qualification in the State, 7.6% of them are found in the Mid-West region with 2.3% of total graduates in County Clare where a similar trend indicates the highest number of graduates in the aforementioned fields of study.
In towns in County Clare, where the population exceeds 1500, the trend shows the higest number of persons with a third level qualification in Ennis, then Shannon, Kilrush, Sixmilebridge and Newmarket-on-Fergus, proportionately reflecting the populations of these towns.
Those graduates with qualifications in Science, Mathematics and Statistics form just 5% of total graduates in Ireland with Clare falling slightly below the State average at 4.6%. Those with qualifications in Humanities and the Social Sciences in the State form almost 10% of the total figure with a similar figure of 9% of total persons with a 3rd level qualification in County Clare. The publication of the Strategy for Science, Technology and Innovation 2006- 2013, aims to almost double the number of SET (Science, Engineering and Technology) PhD graduates and HSS (Humanities and Social Sciences) PhD graduates by 2013 and also aims to promote an ethos of world class research and development across across the spectrum of humanities, physical and social sciences. Total projections for postgraduate numbers in these fields are shown below.
| Year | 2005 | 2006 | 2007 | 2008 | 2009 | 2010 | 2011 | 2012 | 2013 |
|---|---|---|---|---|---|---|---|---|---|
| SET PhD graduates | 543 | 606 | 660 | 724 | 801 | 881 | 919 | 958 | 997 |
| HSS Output PhD Graduates/ Postdocs | 187 | 284 | 234 | 285 | 282 | 300 | 306 | 306 | 315 |
The Expert Group on Future Skills Needs (EGFSN) has the task of advising Government on future skills requirements and associated labour market issues that impact on national potential for enterprise and employment growth. The publication of the report Tomorrow's Skills - Towards a National Skills Strategy (2007) proposes a vision of Ireland in 2020 in which a well-educated and highly skilled population contributes optimally to a competitive, innovation-driven, knowledge-based, participative and inclusive economy. The Group proposes that by 2020 (Figure 1.10): 48% of the labour force should have qualifications at NFQ Levels 6 to 10; 45% should have qualifications at NFQ levels 4 and 5; and the remaining 7% will have qualifications at NFQ levels 1 to 3 but should aspire to achieve skills at higher levels.
Socio-economic Status
Socio-economic status (SES) is a term that generally describes the position of an individual group in a population or society, reflecting the overall hierarchy. The most frequently used indicators of SES are employment and occupational categories. Census 2006 provides data on the SES of the population, classifying individuals according to whether they are working, unemployed, looking for first regular job, employer, employee, assisting relative, students, working in the home or unable to work due to sickness or other disability.
| Employment Status | Total at work and unemployed | Total at work | Employer or own account worker | Employee | Assisting relative | Unemployed having lost or given up previous job |
|---|---|---|---|---|---|---|
| Clare | 54077 | 50607 | 9751 | 40688 | 168 | 3470 |
| Limerick | 87231 | 80525 | 12185 | 68097 | 243 | 6706 |
| North Tipperary | 31352 | 29355 | 6136 | 23080 | 139 | 1997 |
| Mid-West | 172660 | 160487 | 28072 | 131865 | 550 | 12173 |
| State | 2080126 | 1930042 | 308221 | 1616304 | 5517 | 150084 |
| Ennis | 12544 | 11497 | 1398 | 10075 | 24 | 1047 |
| Shannon | 4961 | 4592 | 362 | 4225 | 5 | 369 |
| Kilrush | 1128 | 999 | 152 | 843 | 4 | 129 |
| Sixmilebridge | 882 | 828 | 83 | 745 | 0 | 54 |
| Newmarket- on-Fergus | 797 | 740 | 52 | 685 | 3 | 57 |
According to the Census figures for 2006, 57% of the total population of the State were at work while 4% were categorised as unemployed. Of the total population of County Clare (110,950), 50,607 (45.6%) were classified as at work while 3.12% were classed as unemployed, below the State average. 0.15% of the population of Clare was classed as assisting a relative. This compares favourably with average figures for the Mid-West region which shows that in 2006, 44.4% of the population was classified as at work, with 3.37% categorised as unemployed and 0.15% assisting a relative.
| Area | Total | Looking for first regular job | Student | Looking after home/ family | Retired | Unable to work due to permanent sickness/disability | Other |
|---|---|---|---|---|---|---|---|
| Clare | 86977 | 698 | 7887 | 10202 | 10522 | 3257 | 334 |
| Limerick | 148112 | 1335 | 18632 | 16631 | 16201 | 7312 | 770 |
| North | 51921 | 381 | 4758 | 6563 | 6470 | 2267 | 130 |
| Mid-West | 287010 | 2414 | 31277 | 33396 | 33193 | 12836 | 1234 |
| Ennis | 19135 | 271 | 1462 | 1858 | 2077 | 828 | 95 |
| Shannon | 7319 | 61 | 655 | 726 | 601 | 292 | 23 |
| Kilrush | 2192 | 26 | 148 | 282 | 418 | 185 | 5 |
| Sixmilebridge | 1268 | 8 | 112 | 133 | 72 | 60 | 1 |
| Newmarket-on-Fergus | 1267 | 4 | 129 | 126 | 151 | 56 | 4 |
For those towns in County Clare with a population in excess of 1500, Ennis records 52.1% of the population as at work, with 4.7% as unemployed and 0.1% assisting a relative. Similar figures are available for Shannon with 53.6% of the population at work, 4.3% unemployed and 0.1% assisting a relative. For the smaller towns, Kilrush records a total of 37% at work with 4.8% unemployed, Sixmilebridege stands at 62.3% at work with 4% unemployed and Newmarket-on-Fergus records 49.4% at work with 3.8% unemployed.
The statistics indicate that of those persons aged 15 and over classified by principal economic status, 0.8% of total persons in County Clare are looking for their first regular job, while 9% are students, 11.7% are looking after home/family, 3.74% are disabled or coping with a permanent sickness and 12% are retired. This compares to the average for the Mid-West which currently stands at 0.84% looking for their first regular job, 10.9% are students, while 11.6% are looking after home and family, 11.5% are retired and 4.5% are unable to work due to permanent disability or illness.
Broad Industrial Group
The following Table 1.11 compares the numbers at work in the Mid-West region and in the larger towns in County Clare broken down by industrial group.
| Industry | Clare | Limerick | North Tipp | Mid-West | State | Ennis | Shannon | Kilrush | Sixmilebridge | Newmarket-on-Fergus |
|---|---|---|---|---|---|---|---|---|---|---|
| Total | 50607 | 80525 | 29355 | 160487 | 1930042 | 11497 | 4592 | 999 | 828 | 740 |
| Agriculture, forestry & fishing | 3213 | 4161 | 2822 | 10196 | 89277 | 94 | 31 | 13 | 11 | 10 |
| Mining, quarrying & turf production | 261 | 152 | 440 | 853 | 7751 | 60 | 7 | 1 | 2 | 4 |
| Manufacturing industrial | 7364 | 15688 | 4272 | 27324 | 243182 | 1657 | 1330 | 85 | 178 | 139 |
| Electricity gas & water | 636 | 433 | 157 | 1226 | 11290 | 102 | 8 | 83 | 3 | 1 |
| Construction | 6071 | 8224 | 3433 | 17728 | 215184 | 1355 | 267 | 147 | 88 | 71 |
| Wholesale & retail trade | 5636 | 10688 | 4034 | 20358 | 257309 | 1492 | 419 | 170 | 90 | 62 |
| Hotels & restaurants | 3102 | 4059 | 1286 | 8447 | 100731 | 869 | 300 | 63 | 59 | 90 |
| Transport, storage and communications | 3408 | 4722 | 1279 | 9409 | 105705 | 712 | 585 | 33 | 98 | 94 |
| Banking and financial services | 1406 | 1964 | 725 | 4095 | 85413 | 386 | 197 | 18 | 28 | 19 |
| Real estate, renting & business | 3747 | 6496 | 1540 | 11783 | 180973 | 963 | 542 | 54 | 85 | 50 |
| Public administration & defence | 2539 | 3107 | 1946 | 7592 | 101264 | 746 | 115 | 29 | 30 | 23 |
| Education | 3465 | 5969 | 2091 | 11525 | 127476 | 811 | 158 | 72 | 33 | 36 |
| Health & social work | 4128 | 7937 | 2708 | 14773 | 191219 | 1019 | 133 | 104 | 42 | 49 |
| Other comm., social & personal service activities | 1877 | 2867 | 1069 | 5813 | 80358 | 482 | 127 | 31 | 21 | 31 |
| Industry not stated | 3754 | 4058 | 1553 | 9365 | 132910 | 749 | 373 | 96 | 60 | 61 |
In the Mid-West a total of 17% work in the manufacturing industry compared to 12.6% in the State, 11% work in the construction industry compared to a similar figure of 11.1% in the State, and a total of 12.7% work in the wholesale and retail trade compared to 13.3% at State level. For County Clare, these figures amount to 14.6% working in the manufacturing industry, with 12% in the construction industry and 11.1% in the wholesale and retail trade. A total of 8.1% are employed in the health and social work sector in County Clare compared to 9.2% in the Mid-West region and almost 10% in the State.
Similar trends are evident in some of the larger towns in County Clare with the greatest proportion of workers in Ennis employed in the manufacturing, retail/ wholesale and construction industries, while in Shannon after manufacturing, the next greatest proportion of the population is employed in the ransportation, storage and communications industry, followed by real estate, renting and business activities.
County of Residence and Place of Work
| County | Number of Commuters from Clare to: | Number of Commuters into Clare from: |
|---|---|---|
| Carlow | 0 | 0 |
| Cavan | 0 | 0 |
| Clare | 23548 | 23548 |
| Cork | 65 | 148 |
| Donegal | 0 | 7 |
| Dublin | 150 | 36 |
| Galway | 574 | 388 |
| Kerry | 7 | 47 |
| Kildare | 0 | 0 |
| Kilkenny | 0 | 6 |
| Laois | 7 | 8 |
| Leitrim | 0 | 0 |
| Limerick | 5688 | 4155 |
| Longford | 0 | 0 |
| Louth | 0 | 0 |
| Mayo | 7 | 8 |
| Meath | 6 | 0 |
| Monaghan | 0 | 0 |
| Offaly | 0 | 23 |
| Roscommon | 0 | 23 |
| Sligo | 14 | 7 |
| Tipperary | 124 | 418 |
| Waterford | 9 | 14 |
| Westmeath | 7 | 0 |
| Wexford | 6 | 9 |
| Wicklow | 0 | 0 |
Table 1.12 clearly indicates that the majority of commuters leaving County Clare are working in Limerick, while the greatest number of commuters into County Clare are also coming from Limerick. The total leaving County Clare to work is 6,664 and the total coming into the county to work from other destinations is 5,297 leaving a net commute figure of -1,367.
Location and Size of Enterprises in County Clare
The Kompass business database contains a range of information covering Irish commercial, industrial and financial companies and provides valuable information on key themes such as type of industry, type of company, location of company, company size and number of employees. Table 1.13 indicates that the majority of companies in County Clare fall under the 0-9 employee category. However, the greatest proportion of employees in the county works in companies with an employee range of between 10-49. The next highest proportion of employees works in companies with an employee range of between 101-250 employees.
| 5 digit code | DED | CO 0-9 | EM 0-9 | CO 10-49 | EM 10-49 | CO 50-100 | EM 50-100 | CO 101-250 | EM 101-250 | CO 251-500 | EM 251-500 | CO 501+ | EM 501+ |
|---|---|---|---|---|---|---|---|---|---|---|---|---|---|
| 16001 | Ennis No 1U | 371 | 969 | 126 | 2407 | 13 | 1040 | 7 | 1078 | 4 | 1185 | ||
| 16002 | Ennis No 2U | 0 | |||||||||||
| 16003 | Ennis No 3U | 0 | |||||||||||
| 16004 | Ennis No 4U | 0 | |||||||||||
| 16005 | Kilrush U.D | 71 | 130 | 19 | 428 | 3 | 175 | 1 | 120 | ||||
| 16006 | Abbey | 5 | 9 | 0 | |||||||||
| 16007 | Carran | 1 | 0 | 1 | 14 | ||||||||
| 16008 | Castletown | 0 | |||||||||||
| 16009 | Derreen | 0 | |||||||||||
| 16010 | Drumcreehy | 12 | 20 | 5 | 93 | 2 | 120 | ||||||
| 16011 | Gleninagh | 2 | 0 | 0 | |||||||||
| 16012 | Lisdoonvarna | 13 | 21 | 7 | 155 | 1 | 75 | ||||||
| 16013 | Mountelva | 0 | |||||||||||
| 10614 | Noughaval | 0 | |||||||||||
| 16015 | Oughtmama | 1 | 16 | ||||||||||
| 16016 | Rathborney | 0 | |||||||||||
| 16017 | Ballyeighter | 0 | |||||||||||
| 10618 | Bosten | 7 | 6 | 6 | 124 | ||||||||
| 16019 | Corrofin | 9 | 19 | 1 | 12 | ||||||||
| 16020 | Glenroe | 0 | |||||||||||
| 16021 | Killinaboy | 0 | |||||||||||
| 16022 | Kiltoraght | 0 | |||||||||||
| 16023 | Muckanagh | 0 | |||||||||||
| 16024 | Rath | 0 | |||||||||||
| 16025 | Ruan | 0 | |||||||||||
| 16026 | Clareabbey | 18 | 40 | 6 | 96 | 2 | 100 | 1 | 235 | ||||
| 16027 | Clenagh | 91 | 261 | 98 | 1948 | 26 | 1878 | 15 | 2454 | 6 | 2476 | 2 | 1350 |
| 16028 | Crusheen | 3 | 12 | 1 | 10 | ||||||||
| 16029 | Doora | 13 | 22 | 0 | |||||||||
| 16030 | Drumline | 27 | 49 | 5 | 66 | 3 | 235 | 1 | 110 | 1 | 300 | ||
| 16031 | Dysert | 0 | |||||||||||
| 16032 | Ennis Rural | 5 | 2 | 3 | 51 | 2 | 320 | ||||||
| 16033 | Furroor | 3 | 2 | 0 | |||||||||
| 16034 | Kilcloher | 2 | 1 | 0 | |||||||||
| 16035 | Killanniv | 3 | 5 | 0 | |||||||||
| 16036 | Killone | 3 | 11 | 1 | 12 | ||||||||
| 16037 | Kilnamona | 1 | 0 | 2 | 28 | ||||||||
| 16038 | Kilraghtis | 6 | 5 | 2 | 28 | ||||||||
| 16039 | Kinturk | 0 | |||||||||||
| 16040 | Newmarket | 6 | 10 | 1 | 15 | 1 | 100 | ||||||
| 16041 | Sixmilebridge | 15 | 23 | 4 | 58 | ||||||||
| 16042 | Spancelhill | 0 | |||||||||||
| 16043 | Templemaley | 0 | |||||||||||
| 16044 | Tomfinlough | 0 | |||||||||||
| 16045 | Urlan | 18 | 31 | 3 | 106 | 1 | 90 | 2 | 380 | ||||
| 16046 | Annagh | 0 | |||||||||||
| 16047 | Ballag | 0 | |||||||||||
| 16048 | Ballyea | 1 | 12 | ||||||||||
| 16049 | Ballysteen | 2 | 2 | 0 | |||||||||
| 16050 | Ballyvaskin | 1 | 1 | 0 | |||||||||
| 16051 | Cloghaun | 1 | 2 | 0 | |||||||||
| 16052 | Cloonanah | 0 | |||||||||||
| 16053 | Clooney | 0 | |||||||||||
| 16054 | Ennistymon | 61 | 135 | 12 | 264 | 2 | 100 | 1 | 140 | ||||
| 16055 | Formoyle | 0 | |||||||||||
| 16056 | Kilfenora | 9 | 20 | 1 | 20 | ||||||||
| 16057 | Killaspuglonane | 1 | 2 | 0 | |||||||||
| 16058 | Killilagh | 22 | 37 | 3 | 33 | ||||||||
| 16059 | Kilshanny | 1 | 2 | 0 | |||||||||
| 16060 | Liscannor | 10 | 13 | 3 | 52 | ||||||||
| 16061 | Lurragha | 1 | 0 | 0 | |||||||||
| 16062 | Magherareagh | 0 | |||||||||||
| 16063 | Miltown Malbay | 29 | 60 | 5 | 78 | ||||||||
| 16064 | Moy | 3 | 3 | 0 | |||||||||
| 16065 | Smithstown | 0 | |||||||||||
| 16066 | Ballynacally | 0 | |||||||||||
| 16067 | Clondagad | 1 | 3 | 0 | |||||||||
| 16068 | Coolmeen | 1 | 5 | 0 | |||||||||
| 16069 | Kilchreest | 2 | 6 | 0 | |||||||||
| 16070 | Kilfiddane | 1 | 2 | 0 | |||||||||
| 16071 | Killadysert | 8 | 20 | 0 | |||||||||
| 16072 | Killofin | 0 | |||||||||||
| 16073 | Kilmurry | 0 | |||||||||||
| 16074 | Liscasey | 0 | |||||||||||
| 16075 | Lisheen | 0 | |||||||||||
| 16076 | Rinealon | 0 | |||||||||||
| 16077 | Cahermurphy | 0 | |||||||||||
| 16078 | Cloonadrum | 0 | |||||||||||
| 16079 | Clooncoorha | 1 | 10 | ||||||||||
| 16080 | Cooraclare | 0 | |||||||||||
| 16081 | Creegh | 1 | 18 | 1 | 150 | ||||||||
| 16082 | Doonbeg | 2 | 57 | 1 | 55 | ||||||||
| 16083 | Drumelihy | 0 | |||||||||||
| 16084 | Einagh | 0 | |||||||||||
| 16085 | Glenmore | 0 | |||||||||||
| 16086 | Kilballyowen | 0 | |||||||||||
| 16087 | Kilferagh | 0 | |||||||||||
| 16088 | Kilkee | 2 | 47 | ||||||||||
| 16089 | Killard | 0 | |||||||||||
| 16090 | Killimer | 0 | |||||||||||
| 16091 | Kilmihil | 2 | 46 | 1 | 80 | ||||||||
| 16092 | Kilmurry Ibrickane | 0 | |||||||||||
| 16093 | Kilrush Rural | 0 | |||||||||||
| 16094 | Knock | 0 | |||||||||||
| 16095 | Knocknaboley | 0 | |||||||||||
| 16096 | Knocknagore | 0 | |||||||||||
| 16097 | Moveen | 0 | |||||||||||
| 16098 | Moyarta | 0 | |||||||||||
| 16099 | Mullagh | 0 | |||||||||||
| 16100 | Querinn | 0 | |||||||||||
| 16101 | Rohona | 0 | |||||||||||
| 16102 | St. Martin’s | 0 | |||||||||||
| 16103 | Tullig | 0 | |||||||||||
| 16104 | Tullycreen | 0 | |||||||||||
| 16105 | Ballycannan | 0 | |||||||||||
| 16106 | Ballyglass | 5 | 111 | 3 | 210 | ||||||||
| 16107 | Cappavilla | 0 | |||||||||||
| 16108 | Castlecrine | 0 | |||||||||||
| 16109 | Clogher | 1 | |||||||||||
| 16110 | Cloontra | 15 | |||||||||||
| 16111 | Cratloe | 0 | 1 | 50 | |||||||||
| 16112 | Fahymore | 0 | |||||||||||
| 16113 | Killeely | 0 | |||||||||||
| 16114 | Killokennedy | 0 | |||||||||||
| 16115 | Kilseily | 0 | |||||||||||
| 16116 | Kilteananlea | 1 | 30 | ||||||||||
| 16117 | Lackareagh | 0 | |||||||||||
| 16118 | Mountrivers | 3 | 34 | ||||||||||
| 16119 | O’Briensbridge | 1 | 12 | ||||||||||
| 16120 | Ayle | 0 | |||||||||||
| 16121 | Boherglass | 0 | |||||||||||
| 16122 | Caherhurley | 0 | |||||||||||
| 16123 | Cahermurphy CE | 1 | 45 | ||||||||||
| 16124 | Cappaghabaun | 0 | |||||||||||
| 16125 | Carrowbaun | 0 | |||||||||||
| 16126 | Cloonusker | 1 | 10 | ||||||||||
| 16127 | Coolreagh | 0 | |||||||||||
| 16128 | Corlea | 0 | |||||||||||
| 16129 | Derrynagittagh | 0 | |||||||||||
| 16130 | Drummaan | 2 | 35 | ||||||||||
| 16131 | Feakle | 0 | |||||||||||
| 16132 | Iniscealtra N | 0 | |||||||||||
| 16133 | Iniscealtra S | 0 | |||||||||||
| 16134 | Killaloe | 0 | |||||||||||
| 16135 | Mountshannon | 0 | |||||||||||
| 16136 | Ogonnelloe | 1 | 10 | ||||||||||
| 16137 | Scarriff | 11 | 239 | 1 | 150 | ||||||||
| 16138 | Ballyblood | 0 | |||||||||||
| 16139 | Ballynahinch | 0 | |||||||||||
| 16140 | Caher | 0 | |||||||||||
| 16141 | Clooney | 0 | |||||||||||
| 16142 | Dangan | 0 | |||||||||||
| 16143 | Glebdree | 0 | |||||||||||
| 16144 | Kilkishen | 5 | 111 | ||||||||||
| 16145 | Killanena | 0 | |||||||||||
| 16146 | Killuran | 0 | 1 | 226 | |||||||||
| 16147 | Kiltannon | 0 | |||||||||||
| 16148 | Kyle | 1 | 15 | ||||||||||
| 16149 | Loughea | 0 | |||||||||||
| 16150 | Newgrove | 0 | |||||||||||
| 16151 | Quin | 2 | 70 | ||||||||||
| 16152 | Rathclooney | 0 | |||||||||||
| 16153 | Rossroe | 0 | |||||||||||
| 16154 | Toberbreeda | 0 | |||||||||||
| 16155 | Tulla | 0 | 1 | 70 |
| County ID | County | FDI Projects per capita 03-07 RANKED | FDI Investment per capita 03-07 (€m) RANKED | Number employed by FDI per capita 03-07 RANKED | County Total Projects as % Country Total RANKED | County Total Investments as % Country Total RANKED | County Total Jobs Created as % of Country Total |
|---|---|---|---|---|---|---|---|
| 1 | Carlow | 21 | 22 | 18 | 21 | 21 | 20 |
| 2 | Cavan | 22 | 11 | 16 | 22 | 13 | 18 |
| 3 | Clare | 4 | 4 | 6 | 7 | 5 | 6 |
| 4 | Cork | 6 | 2 | 7 | 2 | 2 | 2 |
| 5 | Donegal | 13 | 14 | 12 | 8 | 11 | 9 |
| 6 | Dublin | 1 | 7 | 3 | 1 | 1 | 1 |
| 7 | Galway | 9 | 18 | 11 | 3 | 17 | 5 |
| 8 | Kerry | 17 | 19 | 23 | 14 | 19 | 21 |
| 9 | Kildare | 8 | 1 | 10 | 5 | 3 | 7 |
| 10 | Kilkenny | 20 | 16 | 24 | 20 | 15 | 24 |
| 11 | Laois | 25 | 23 | 25 | 25 | 23 | 25 |
| 12 | Leitrim | 15 | 24 | 20 | 23 | 24 | 23 |
| 13 | Limerick | 10 | 12 | 17 | 6 | 9 | 15 |
| 14 | Longford | 7 | 10 | 1 | 18 | 14 | 12 |
| 15 | Louth | 2 | 13 | 2 | 4 | 12 | 3 |
| 16 | Mayo | 19 | 3 | 21 | 17 | 4 | 19 |
| 17 | Meath | 23 | 25 | 19 | 19 | 25 | 17 |
| 18 | Monaghan | 26 | 26 | 26 | 26 | 26 | 26 |
| 19 | Offaly | 24 | 21 | 22 | 24 | 22 | 22 |
| 20 | Roscommon | 12 | 5 | 4 | 15 | 10 | 11 |
| 21 | Sligo | 3 | 15 | 5 | 11 | 16 | 10 |
| 22 | Tipperary | 14 | 9 | 9 | 12 | 6 | 4 |
| 23 | Waterford | 11 | 6 | 13 | 10 | 8 | 14 |
| 24 | Westmeath | 5 | 17 | 8 | 9 | 18 | 8 |
| 25 | Wexford | 16 | 20 | 15 | 13 | 20 | 16 |
| 26 | Wicklow | 18 | 8 | 14 | 16 | 7 | 13 |
Ireland's unprecedented levels of economic growth in recent decades have been attributed, in large part, to foreign direct investment (FDI), particularly from the United States. Ireland has continually nurtured the climate for investment and through its investment promotion arm (IDA), has aggressively sought investment projects. Direct investment plays a unique role in the Irish economy, accounting for a larger part of its manufacturing output, employment and exports than in most other OECD countries. Stocks (positions) of direct investment abroad reached €93,619m at the end of 2006, continuing to approach the level of inward investment (€118,901m). Most of the total outward position is accounted for by European countries (€68,944m), partly made up of: UK (€24,269m), Netherlands (€7,039m) and European Offshore Centres (€5,547m). At the end of 2006, stocks of direct investment into Ireland stood at €118,901m, compared with €138,620m at the end of 2005. As with the outward position, the majority of the total year-end inward position was attributable to EU countries, mainly: Luxembourg (€32,457m), Netherlands (€26,601m) and UK (€16,366m).
The table above shows FDI Projects, Investments and Jobs created as a result in each county in Ireland from 2003-2007. Table 1.15 subsequently ranks each of the 26 counties accordingly, and shows that Clare is positioned 4th highest in the country for both FDI Projects and FDI Investments in that period and ranks 6th in terms of numbers employed by FDI per capita.
| County ID | County | FDI Projects per capita 03-07 RANKED | FDI Investment per capita 03-07 (€m) RANKED | Number employed by FDI per capita 03-07 RANKED | County Total Projects as % Country Total RANKED | County Total Investments as % Country Total RANKED | County Total Jobs Created as % of Country Total |
|---|---|---|---|---|---|---|---|
| 1 | Carlow | 21 | 22 | 18 | 21 | 21 | 20 |
| 2 | Cavan | 22 | 11 | 16 | 22 | 13 | 18 |
| 3 | Clare | 4 | 4 | 6 | 7 | 5 | 6 |
| 4 | Cork | 6 | 2 | 7 | 2 | 2 | 2 |
| 5 | Donegal | 13 | 14 | 12 | 8 | 11 | 9 |
| 6 | Dublin | 1 | 7 | 3 | 1 | 1 | 1 |
| 7 | Galway | 9 | 18 | 11 | 3 | 17 | 5 |
| 8 | Kerry | 17 | 19 | 23 | 14 | 19 | 21 |
| 9 | Kildare | 8 | 1 | 10 | 5 | 3 | 7 |
| 10 | Kilkenny | 20 | 16 | 24 | 20 | 15 | 24 |
| 11 | Laois | 25 | 23 | 25 | 25 | 23 | 25 |
| 12 | Leitrim | 15 | 24 | 20 | 23 | 24 | 23 |
| 13 | Limerick | 10 | 12 | 17 | 6 | 9 | 15 |
| 14 | Longford | 7 | 10 | 1 | 18 | 14 | 12 |
| 15 | Louth | 2 | 13 | 2 | 4 | 12 | 3 |
| 16 | Mayo | 19 | 3 | 21 | 17 | 4 | 19 |
| 17 | Meath | 23 | 25 | 19 | 19 | 25 | 17 |
| 18 | Monaghan | 26 | 26 | 26 | 26 | 26 | 26 |
| 19 | Offaly | 24 | 21 | 22 | 24 | 22 | 22 |
| 20 | Roscommon | 12 | 5 | 4 | 15 | 10 | 11 |
| 21 | Sligo | 3 | 15 | 5 | 11 | 16 | 10 |
| 22 | Tipperary | 14 | 9 | 9 | 12 | 6 | 4 |
| 23 | Waterford | 11 | 6 | 13 | 10 | 8 | 14 |
| 24 | Westmeath | 5 | 17 | 8 | 9 | 18 | 8 |
| 25 | Wexford | 16 | 20 | 15 | 13 | 20 | 16 |
| 26 | Wicklow | 18 | 8 | 14 | 16 | 7 | 13 |
Census of Industrial Production 2005
| Code | Type | Clare | Limerick | Tipp NR | Mid-West |
|---|---|---|---|---|---|
| 1 | Number of Local Units | 161 | 205 | 83 | 449 |
| 2 | Supervisors and Operatives - male |
3678 | 7753 | 2613 | 14044 |
| 3 | Supervisors and Operatives - female |
1020 | 3010 | 758 | 4788 |
| 4 | Apprentices - male | 156 | 133 | 13 | 302 |
| 5 | Apprentices - female | 25 | 26 | 3 | 54 |
| 6 | Apprentices - Total | 4879 | 10922 | 3387 | 19188 |
| 7 | Clerical staff - male | 635 | 740 | 177 | 1552 |
| 8 | Clerical staff - female | 534 | 846 | 269 | 1649 |
| 9 | Admin and Technical Staff - males |
929 | 2095 | 427 | 3451 |
| 10 | Admin and Technical Staff - female |
494 | 736 | 123 | 1253 |
| 11 | Admin and Technical Staff - Total |
2592 | 4417 | 996 | 8005 |
| 12 | Total Employees | 7471 | 15339 | 4383 | 27193 |
| 13 | male | 5398 | 10721 | 3230 | 19349 |
| 14 | female | 2073 | 4618 | 1153 | 7844 |
| 15 | Proprietors/Unpaid | 56 | 85 | 36 | 177 |
| 16 | Total Persons | 7527 | 15424 | 4419 | 27320 |
| 17 | male | 5441 | 10782 | 3251 | 19474 |
| 18 | female | 2086 | 4624 | 1168 | 7896 |
| 19 | Outside piece workers | 29 | 36 | 5 | 70 |
| 20 | Gross Output | 2024942 | 13679952 | 859810 | 16564704 |
| 21 | Materials for processing | 60857 | 8444191 | 422326 | 9475034 |
| 22 | In services | 68851 | 618762 | 110378 | 797991 |
| 23 | Fuel and Power | 29714 | 149739 | 28143 | 207597 |
| 24 | Total | 707082 | 9212692 | 560848 | 10480622 |
| 25 | Net Output | 1317860 | 4467260 | 298963 | 6084082 |
| 26 | Industrial Workers | 155926 | 300422 | 97919 | 554267 |
| 27 | Other Employees | 109374 | 251096 | 42551 | 403021 |
| 28 | Outside piece workers | 430 | 745 | 383 | 1558 |
| 29 | Total | 265730 | 552263 | 140853 | 958846 |
Table 1.16 examines the Census of Industrial Local Units (of the Census of Industrial Production) for 2005. This element of the Census contains 57 variables from Number of Local Units to Capital Assets and Derived Variables. In table 1.16, however, 29 of the key variables for 2005 are shown. The period from 2004-2005 indicates a reduction in the total number of industrial units in the Mid-West region from 470 in 2004 to 449 in 2005 with a concomitant reduction in the number of local units in County Clare from 168 to 161. However, the number of industrial workers (including supervisors, operatives and apprentices) has increased in the region from 18,860 in 2004 to 19,188 in 2005, yet in County Clare the number has decreased in the same period from 5,079 in 2004 to 4,879 in 2005.
Of the total employees (6+11) including both Industrial workers (Supervisors and Apprentices) and Other employees (Clerical and Administrative), the total for the region has increased from 26,556 in 2004 to 27,193 in 2005 with a slight decrease in County Clare from 7,589 in 2004 to 7,471 in 2005. Gross industrial output for the region has increased in the same time frame from €14,870,515 in 2004 to €16,564,704 in 2005 with a concomitant increase in County Clare from €1,892,466 to €2,024,942 between 2004-2005. Total industrial input for the region has increased from €9,167,742 to €10,480,622 with figures for County Clare increasing from €580,414 in 2004 to €707,082 in 2005. Wages and salaries have also increased in the region from €906,829 in 2004 to €958,846 with a proportionate increase in Clare from €257,448 in 2004 to €265,730 in 2005.
Summary of Key Trends
- In County Clare, the statistics indicate a population increase of 7.4% from 2002 to 2006. At UD and RD levels the most noticeable population changes occur in the Meelick and Tulla Rural Areas which display population increases of 11.2% and 14.9% respectively.
- Approximately 32.6% of the population of County Clare lives in centres of 1,500 or more with the remaining 67.4% living outside centres of 1,500+, indicating a high level of rurality. This trend is also evident in the Western region where 68.3% of the population lives outside of centres with a population of 1,500 or greater.
- There is a high population density of 100+ persons per square kilometre around the urban district of Ennis with a density of between 50-100 (p/sq km) in the immediate periphery of the town. The majority of DEDs in County Clare indicates a relatively low population density.
- The greatest proportion of persons in County Clare occurs in the working age category of between 16-62 with peaks around the 20-30 age group in both Clare and some key towns in Clare of population in excess of 1,500.
- Those with a third level non-degree in County Clare (11.1%) exceed the State average of 10.6% while those with a third level degree or higher (16.4%) fall below the State average (18.5%).
- 45.6% of the population in Clare was classified as at work in 2006 while 3.12% was classified as unemployed. For towns with a population in excess of 1,500, Ennis records 52.1% of the population at work, with 53.6% working in Shannon. 4.7% of the population of Ennis was classed as unemployed, with 4.3% unemployed in Shannon.
- In the Mid-West region, the greatest proportion of workers are employed in the manufacturing industry (17%), followed by the wholesale and retail trade (12.7%) and then the construction industry (11%). In Clare, the greatest proportion of workers is also found in the manufacturing industry (14.6%), followed by 12% in the construction industry and 11.1% in the retail trade.
- The greatest proportion of commuters leaving Clare is working in County Limerick. Similarly, the highest proportion of commuters from outside destinations also come from County Limerick.
- The majority of companies in County Clare fall under the 0-9 employee category. The greatest proportion of employees in County Clare is employed in enterprise with an employee range of 10-49.
- County Clare ranks fourth in the country for both number of FDI Projects and amount of FDI investment (€) and ranks sixth in the country in terms of numbers employed by FDI per capita.
- The period 2004-2005 indicates a reduction in the total number of industrial units in the Mid-West region from 470 to 449 (Clare from 168-161). Gross industrial output for the region has increased in the region between 2004-2005 with an attendant increase in County Clare from €1,892,466 to €2,024,942.